

Reports
Historical fleet performance over days, weeks and months, with period KPIs, trend charts, a detailed breakdown table and a flexible CSV export
Overview
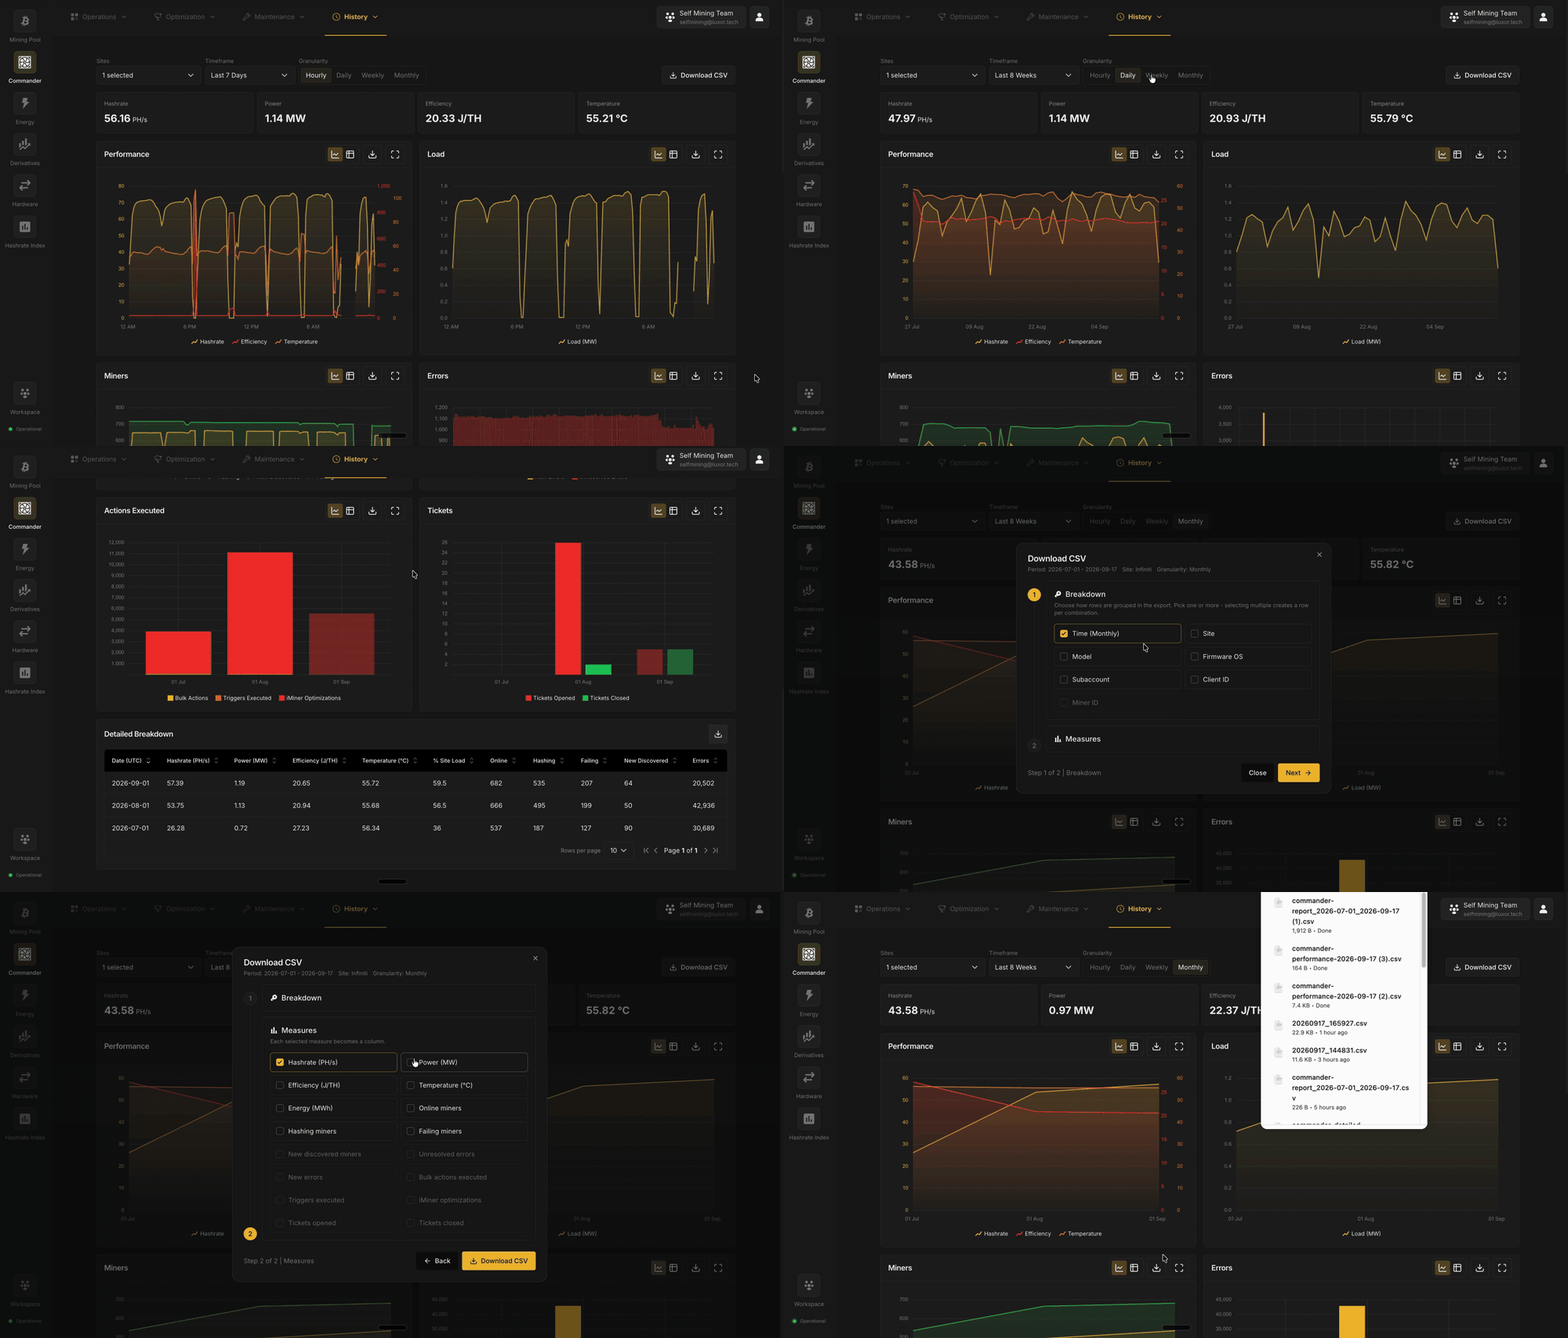
The Dashboard tells you what your fleet is doing right now. Reports tells you what it did over the last week, the last quarter or the last year. Pick one or more sites, a timeframe and a granularity, and Commander turns its telemetry history into period KPIs, six trend charts, a bucket-by-bucket breakdown table and a CSV export you can slice by site, model, firmware, pool subaccount, client or individual miner.
Use it to answer the questions a live view cannot:
- Is the fleet growing or declining? See hashrate, power and online miner counts month over month, with the numbers behind every chart one click away.
- Did the firmware or profile change actually help? Compare efficiency before and after a rollout, and break the export down by firmware to compare cohorts side by side.
- How much energy did each site, or each hosting tenant, consume? Export energy in MWh per site or per client, one row per month, computed on the same basis as your Commander invoice.
- How many miners were really hashing last month? Get a single, consistent average that holds whether you look hourly, daily, weekly or monthly, with downtime counted as downtime.
- Which machines are quietly underperforming? Export per-miner hashrate, power and temperature over the period to find the ones that are online but consistently weak, or running hot before they fail.
- Is automation keeping up with the fleet? See new and unresolved errors, tickets opened and closed, and how many actions came from people, automation rules or Intelligent Miner, over the same timeline.
Reports live under Commander → History → Reports.
Commander Pro Required
The four KPI cards at the top of the page are available on every plan. The charts, the Detailed Breakdown table and the Download CSV builder require Commander Pro. On Commander Lite they are shown blurred with an Activate Pro button.
Controls
Every number on the page follows the three controls in the toolbar.

| Control | Options | Notes |
|---|---|---|
| Sites | One or more of the workspace's sites | Multi-site selections are aggregated (hashrate and power summed, miner counts summed, efficiency and temperature weighted). |
| Timeframe | Last 7 Days, Last 30 Days, Last 8 Weeks (default), Last 12 Months, Custom | Every preset ends at the start of the current UTC day, so the in-progress day is never included. Last 12 Months is not available at Hourly granularity. |
| Granularity | Hourly, Daily (default), Weekly, Monthly | The size of each chart point and table row. Changing granularity resets the timeframe to its natural window: Last 7 Days for Hourly, Last 8 Weeks for the rest. Weekly buckets start on Monday and monthly buckets on the 1st, both in UTC. |
Period KPIs
Four cards summarize the whole selected period. They are averages over the period, not the latest reading.
| KPI | Unit | What it means |
|---|---|---|
| Hashrate | PH/s or TH/s | Average hashrate over the period. Gaps in telemetry count as downtime (zero), so an outage lowers the average rather than being skipped. |
| Power | MW | Average power draw, including an estimated nameplate draw for miners that were hashing but not reporting a power reading. This is the same figure Commander uses for billing, and it can read higher than the Dashboard's Power Consumption card, which only counts measured readings. |
| Efficiency | J/TH | Average energy per terahash over the period. |
| Temperature | °C | Average reported temperature across the fleet. |
Charts
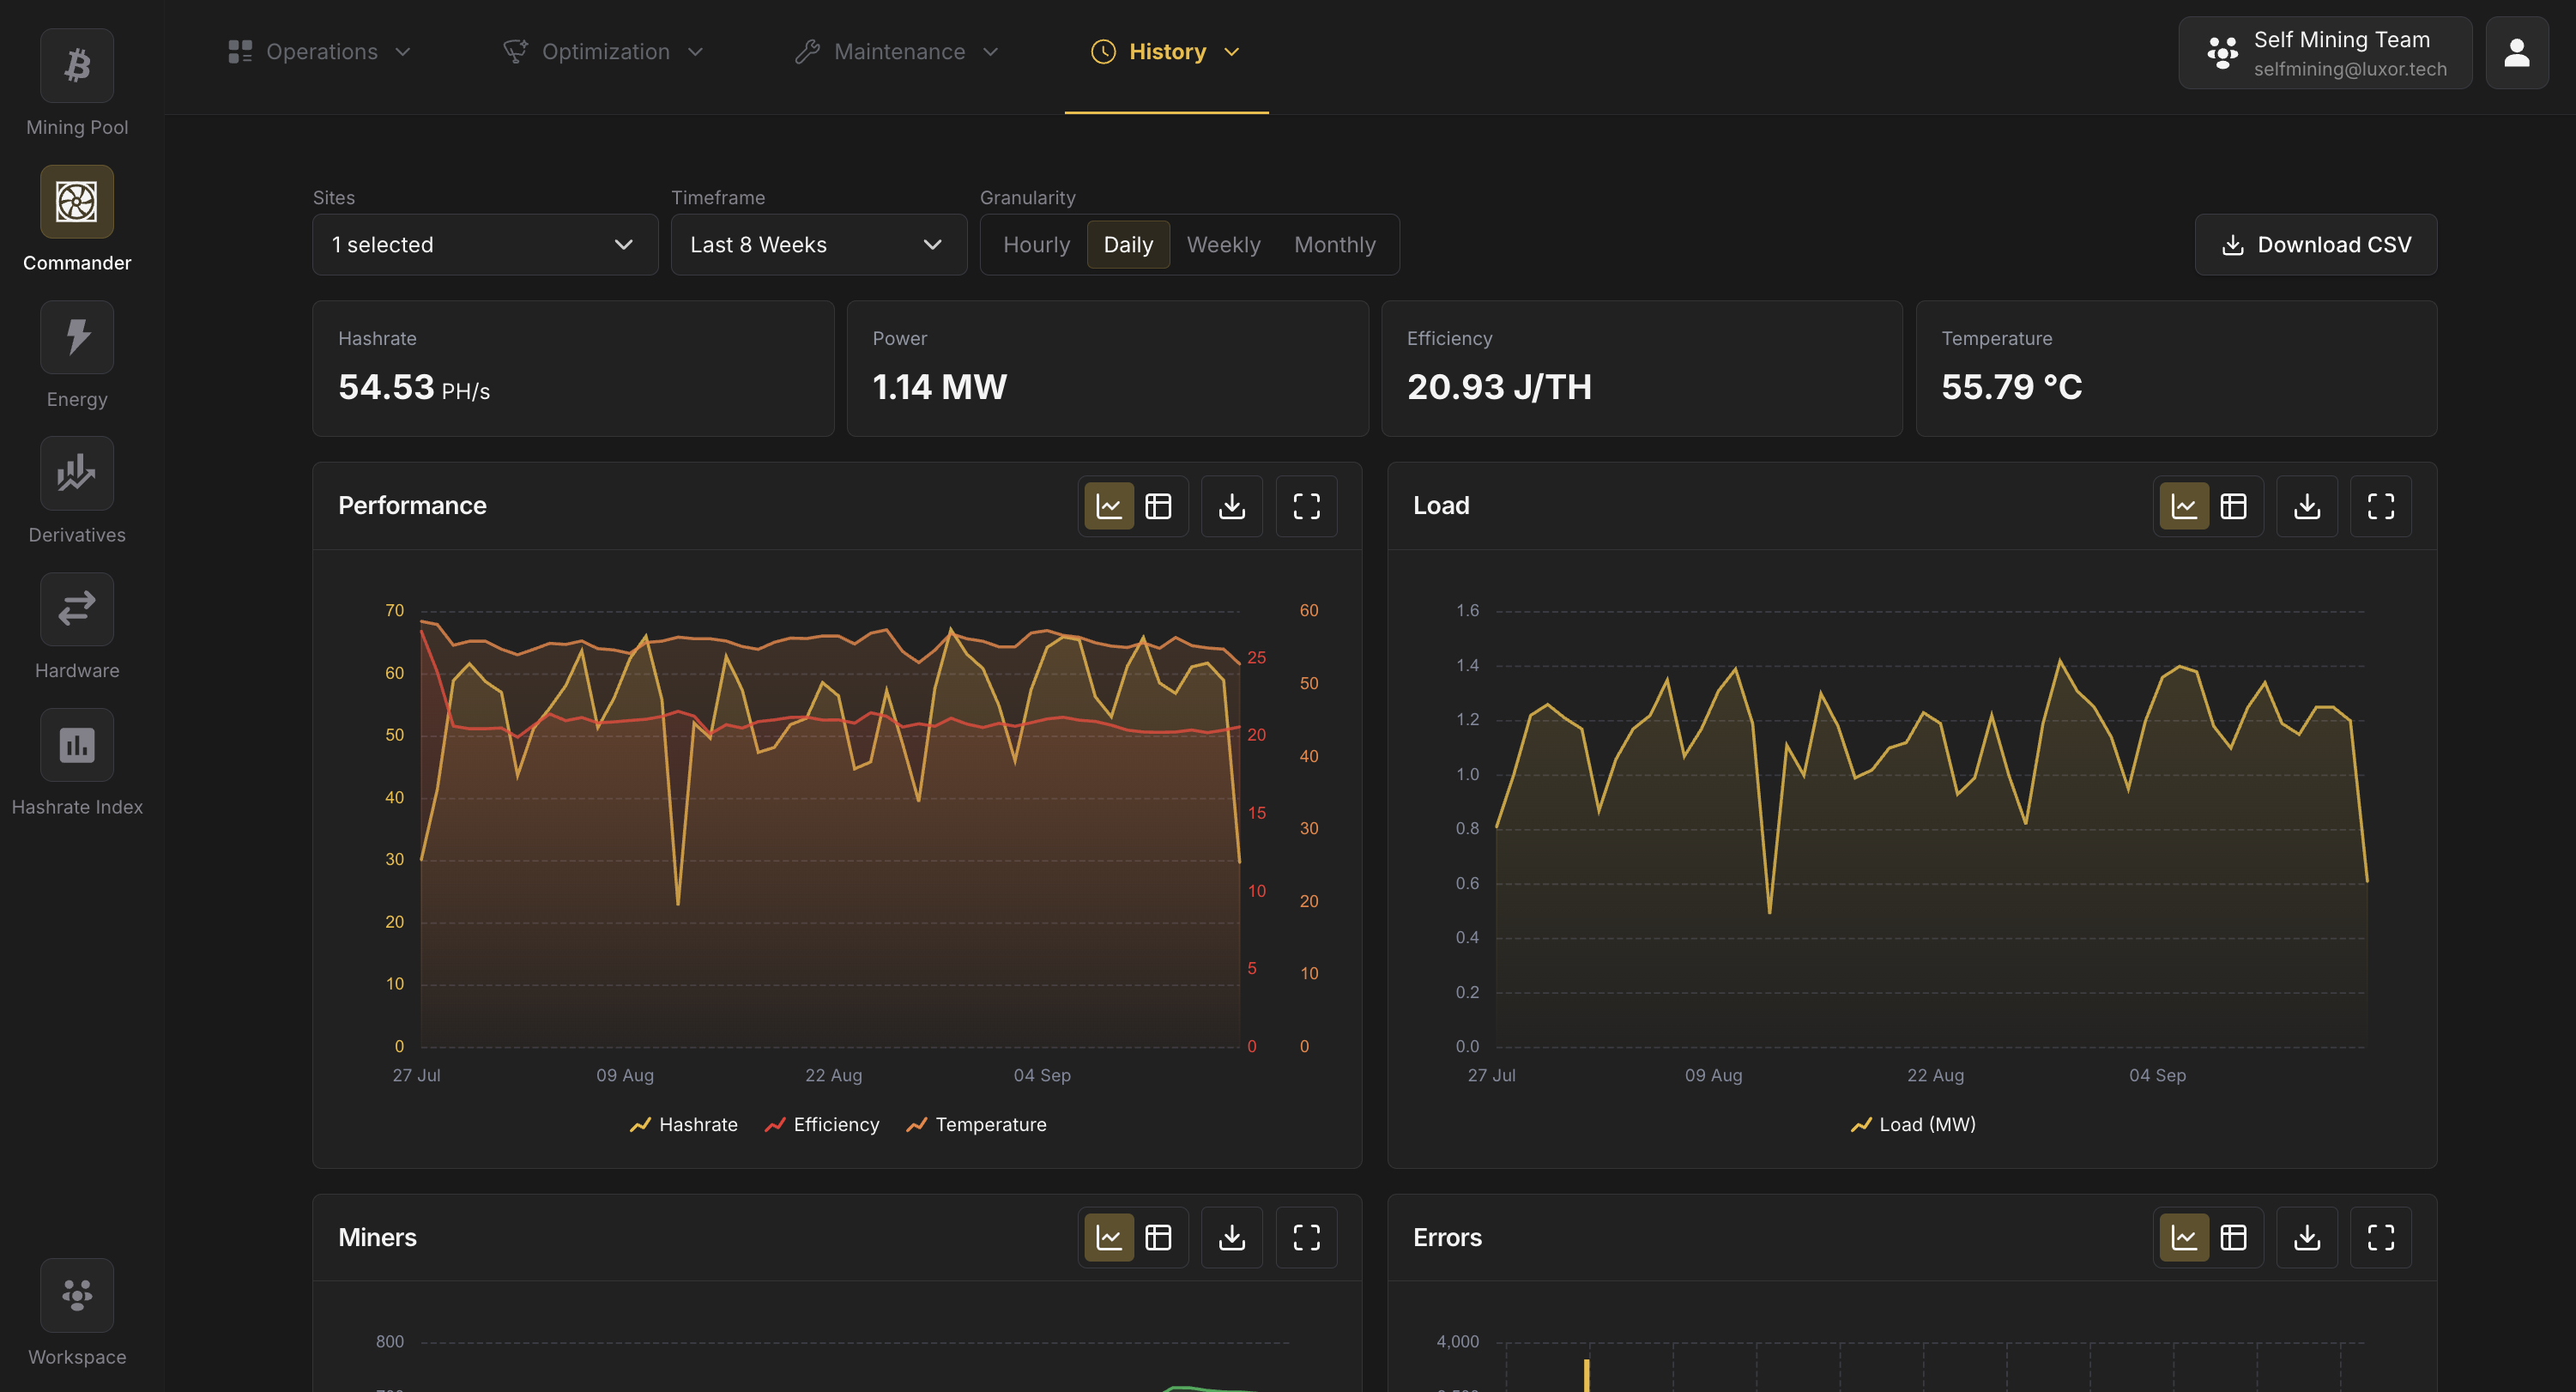
Six widgets plot the selected period at the selected granularity. Each widget can be switched between a chart and a table view, expanded to fullscreen, and downloaded as its own CSV from the icons in its header.
| Widget | Series | Notes |
|---|---|---|
| Performance | Hashrate (PH/s), Efficiency (J/TH), Temperature (°C) | Hashrate on the left axis; efficiency and temperature on the right. |
| Load | Load (MW) | Average power draw per bucket, same basis as the Power KPI. |
| Miners | Online, Hashing, New Discovered, Failing | Counts are the mean number of concurrent miners in each bucket, so they do not change when you switch granularity. All four series share one scale so their relative sizes stay honest. |
| Errors | New Errors, Unresolved Errors | New counts errors that opened during the bucket; Unresolved counts errors still open at the end of it. Retired miners are excluded. Bars are grouped rather than stacked because an unresolved error is usually also a new one. |
| Actions Executed | Bulk Actions, Triggers Executed, Intelligent Miner Optimizations | How many execution plans ran in each bucket, classified by who started them: a person, an Automation Rule, or Intelligent Miner. Loads separately from the other widgets, so the rest of the page never waits on it. |
| Tickets | Tickets Opened, Tickets Closed | From the Tickets feature. Both manual and system-created tickets count. |
If some execution plans could not be counted for the period (very large fleets over long ranges), the Actions Executed totals are a lower bound and the page says so.
Download CSV
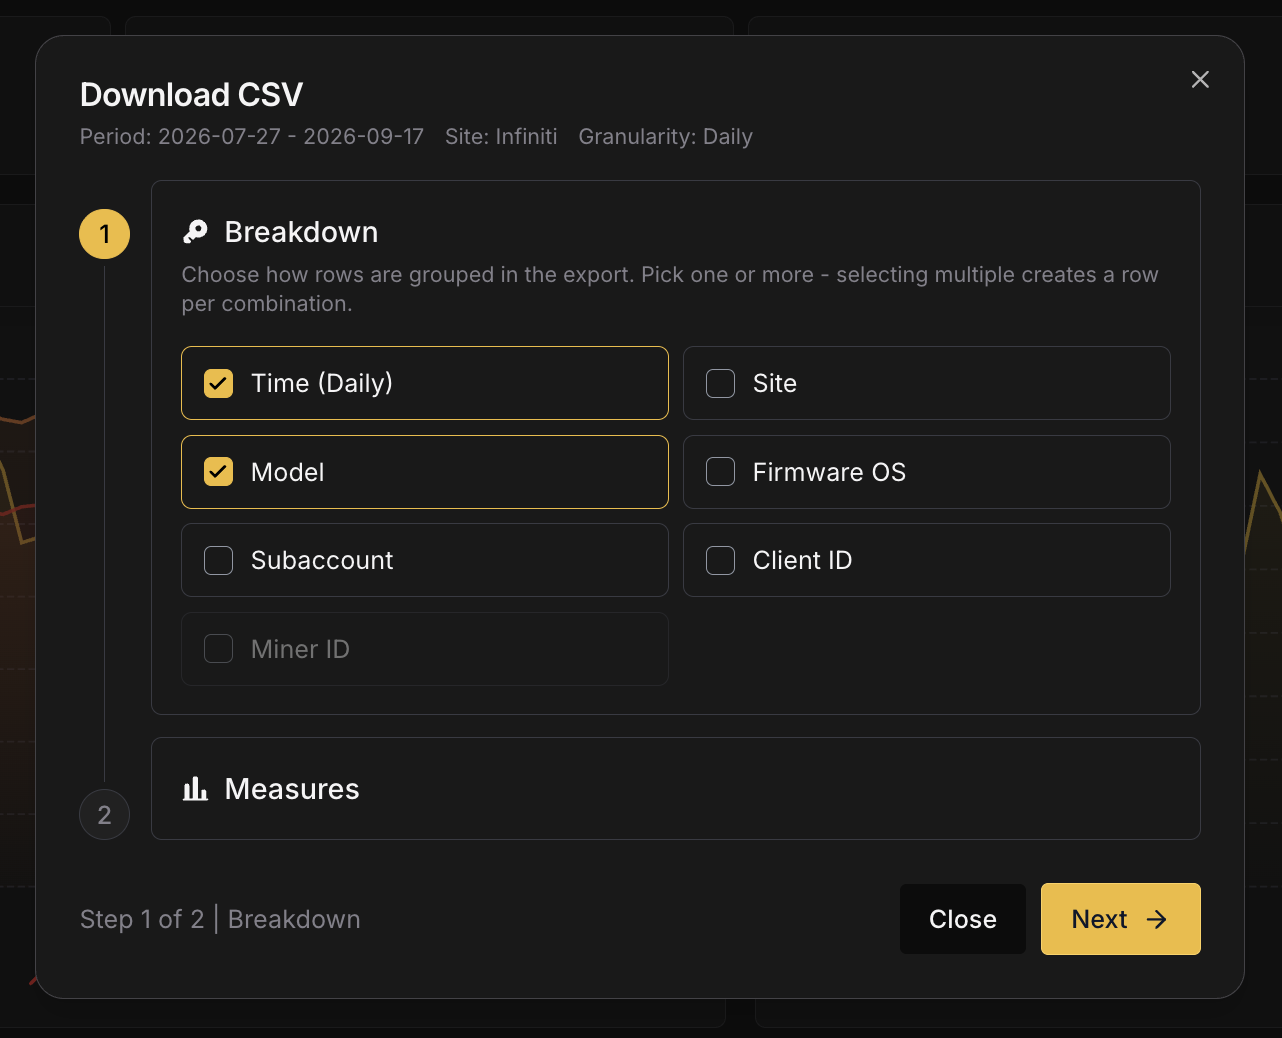
The Download CSV button in the toolbar opens a two-step builder that exports the current site, timeframe and granularity selection in whatever shape your analysis needs.
Step 1: Breakdown
Choose how rows are grouped. Pick one or more; selecting several creates one row per combination (for example Time × Site × Model).
Step 2: Measures
Each selected measure becomes a column. The builder greys out any measure the chosen breakdowns cannot answer and explains why in a tooltip.
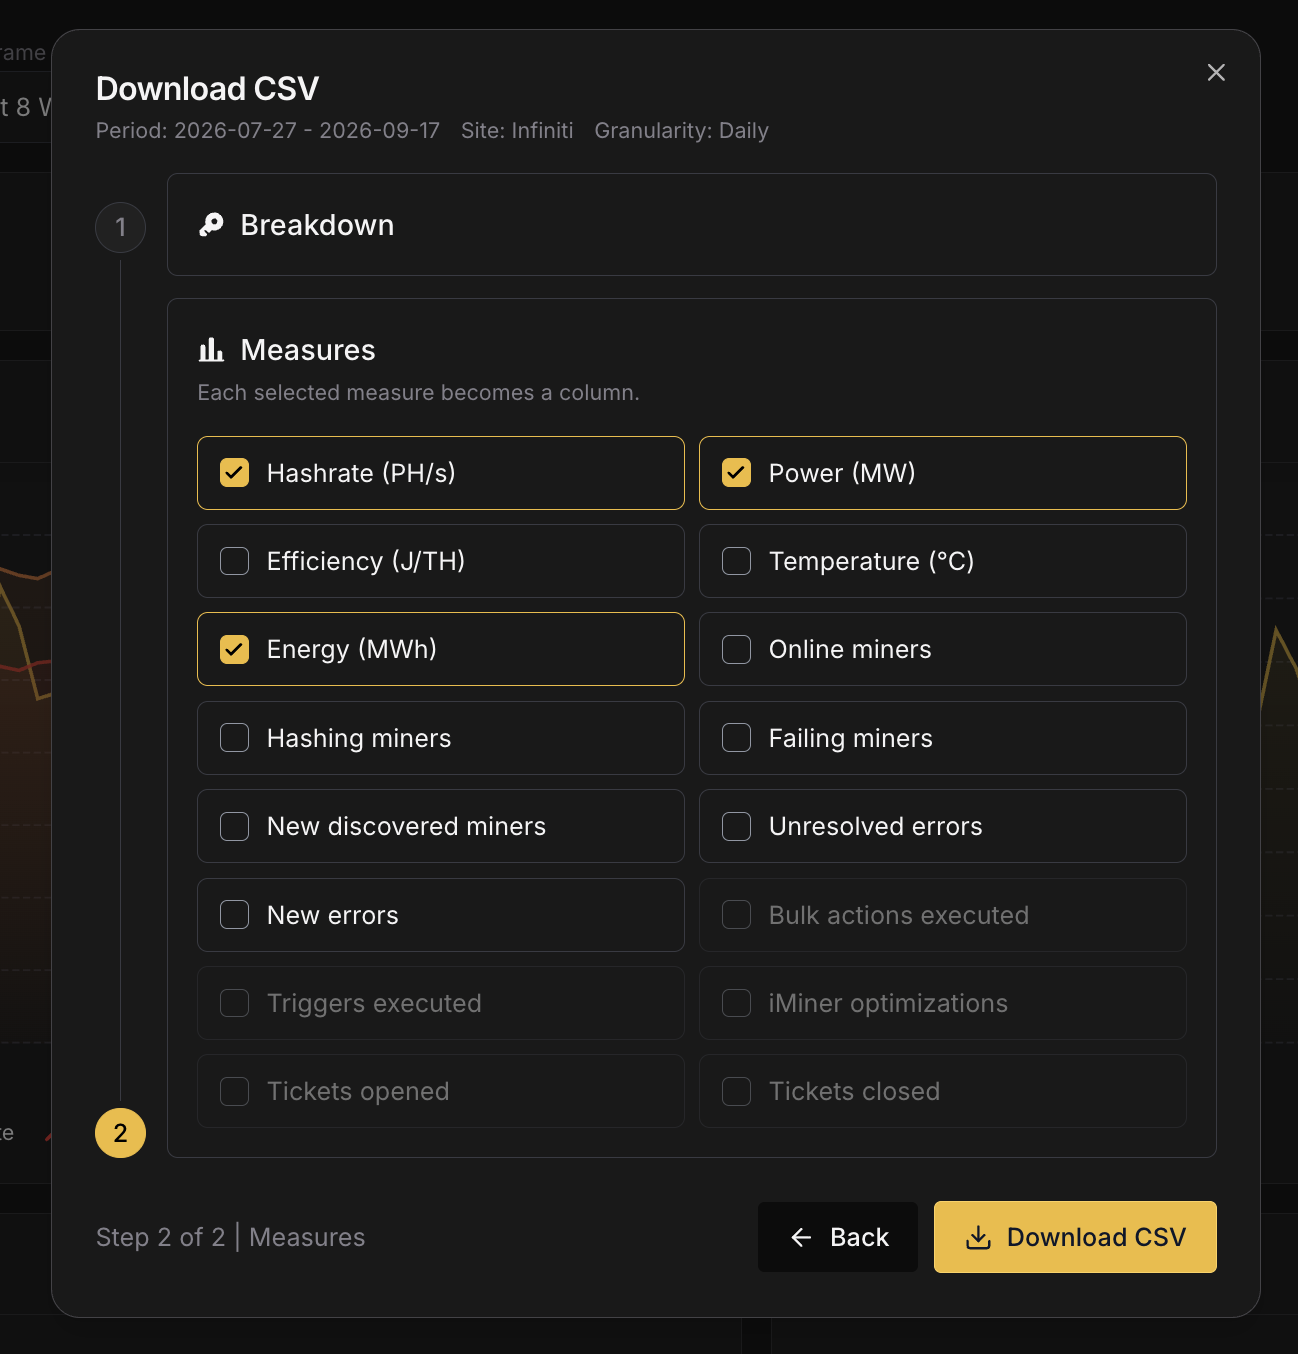
Exports are capped at 100,000 rows. If a selection would exceed that, shorten the period, coarsen the granularity or drop a breakdown. The file is named commander-report_<start>_<end>.csv with UTC dates, and every timestamp inside it is UTC.
How the numbers are computed
A few conventions keep Reports consistent with Commander's other surfaces and with your bill:
- Complete UTC days only. Nothing from the current day is included, at any granularity, so a figure you read today will not change tomorrow.
- Rates divide by wall-clock time. Hashrate, power and efficiency are averaged over the full length of each bucket, not over the samples that happened to arrive. A miner that was offline for half a day contributes half a day of zeros.
- Power matches billing. Miners that are hashing but not reporting a power reading are counted at their nameplate draw, exactly as they are on your Commander Pro invoice. The Dashboard shows measured power only, so Reports can read higher.
- Miner counts are averages. Online, Hashing and Failing are the mean number of miners in that state across the bucket, which is why the numbers hold steady when you switch between Hourly, Daily, Weekly and Monthly.
- Errors come from the event log. New and Unresolved errors are read from the miner event history and deduplicated per event, so the chart, the breakdown table and the CSV agree.