

Miners
Search, filter, and act on every miner in your fleet, whether it is hashing at a site or sitting in storage
Overview
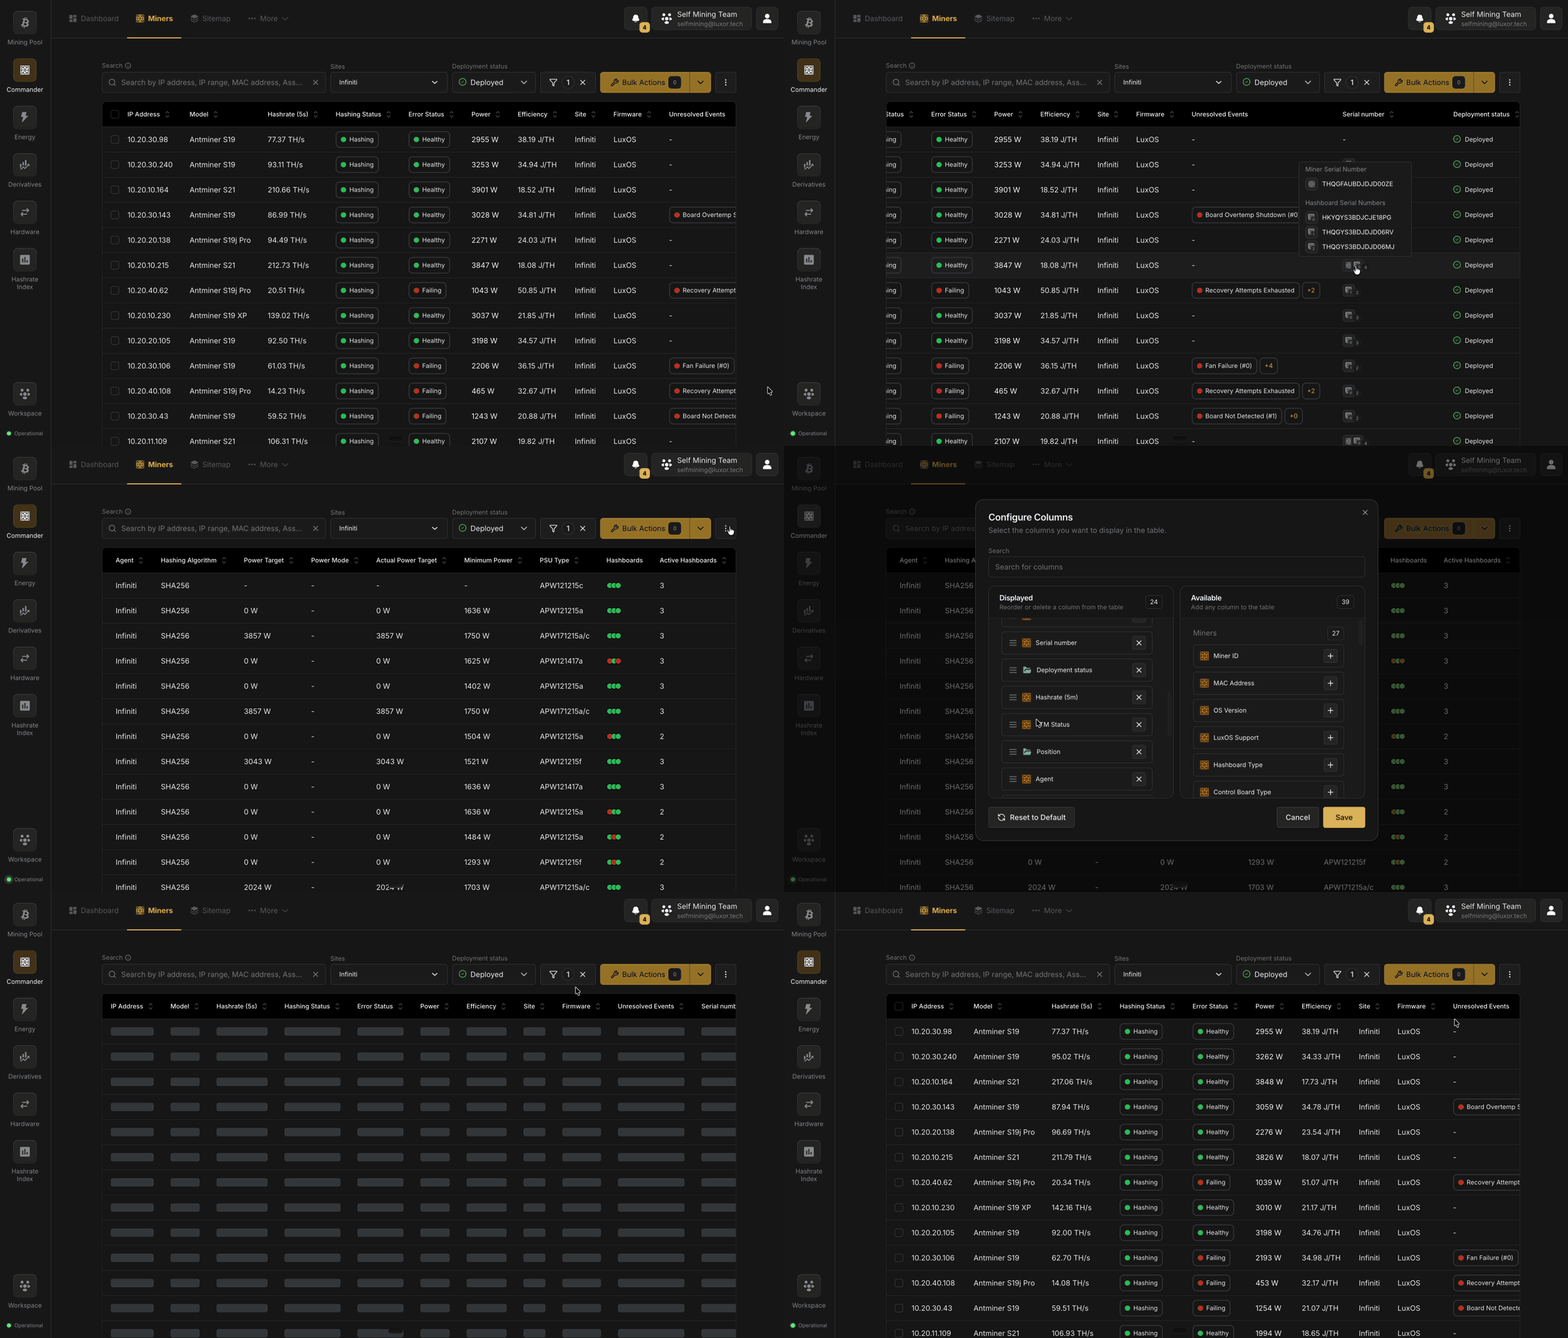
The Miners page is where you work with specific machines rather than fleet-level aggregates. It lists every miner you own, whether it is hashing at a site right now or sitting in storage, and it is where you find a machine, act on it, and open its details.
Each miner combines two kinds of data:
- Live telemetry reported by your Agents: hashrate, power, temperature, health, pool, firmware, and online state.
- User-managed details that you maintain: purchase and warranty information, hosting client, custom fields, notes, and files.
Every miner also has a deployment status that tracks where it is in its physical life, from Ready to Deploy through Retired. See Miner Lifecycle.
The Miners section has four pages:
| Page | Covers |
|---|---|
| Miners (this page) | The Miners table: searching, filtering, columns, the table menu, and alerts |
| Miner Details | The page for a single miner: live data, user-managed details, and logs |
| Miner Lifecycle | Deployment statuses, adding miners, retiring, deleting, restoring, and consolidating them |
| User-Managed Details | The fields you keep about each miner, custom fields, and hosting clients |
Toolbar
The toolbar above the table contains:
- Search: find miners by IP address, MAC address, Asset code, model, and more.
- Sites: limit the page to one or more Sites.
- Deployment status: choose which miners to list (see Deployment Status Views). Each option shows how many miners have that status.
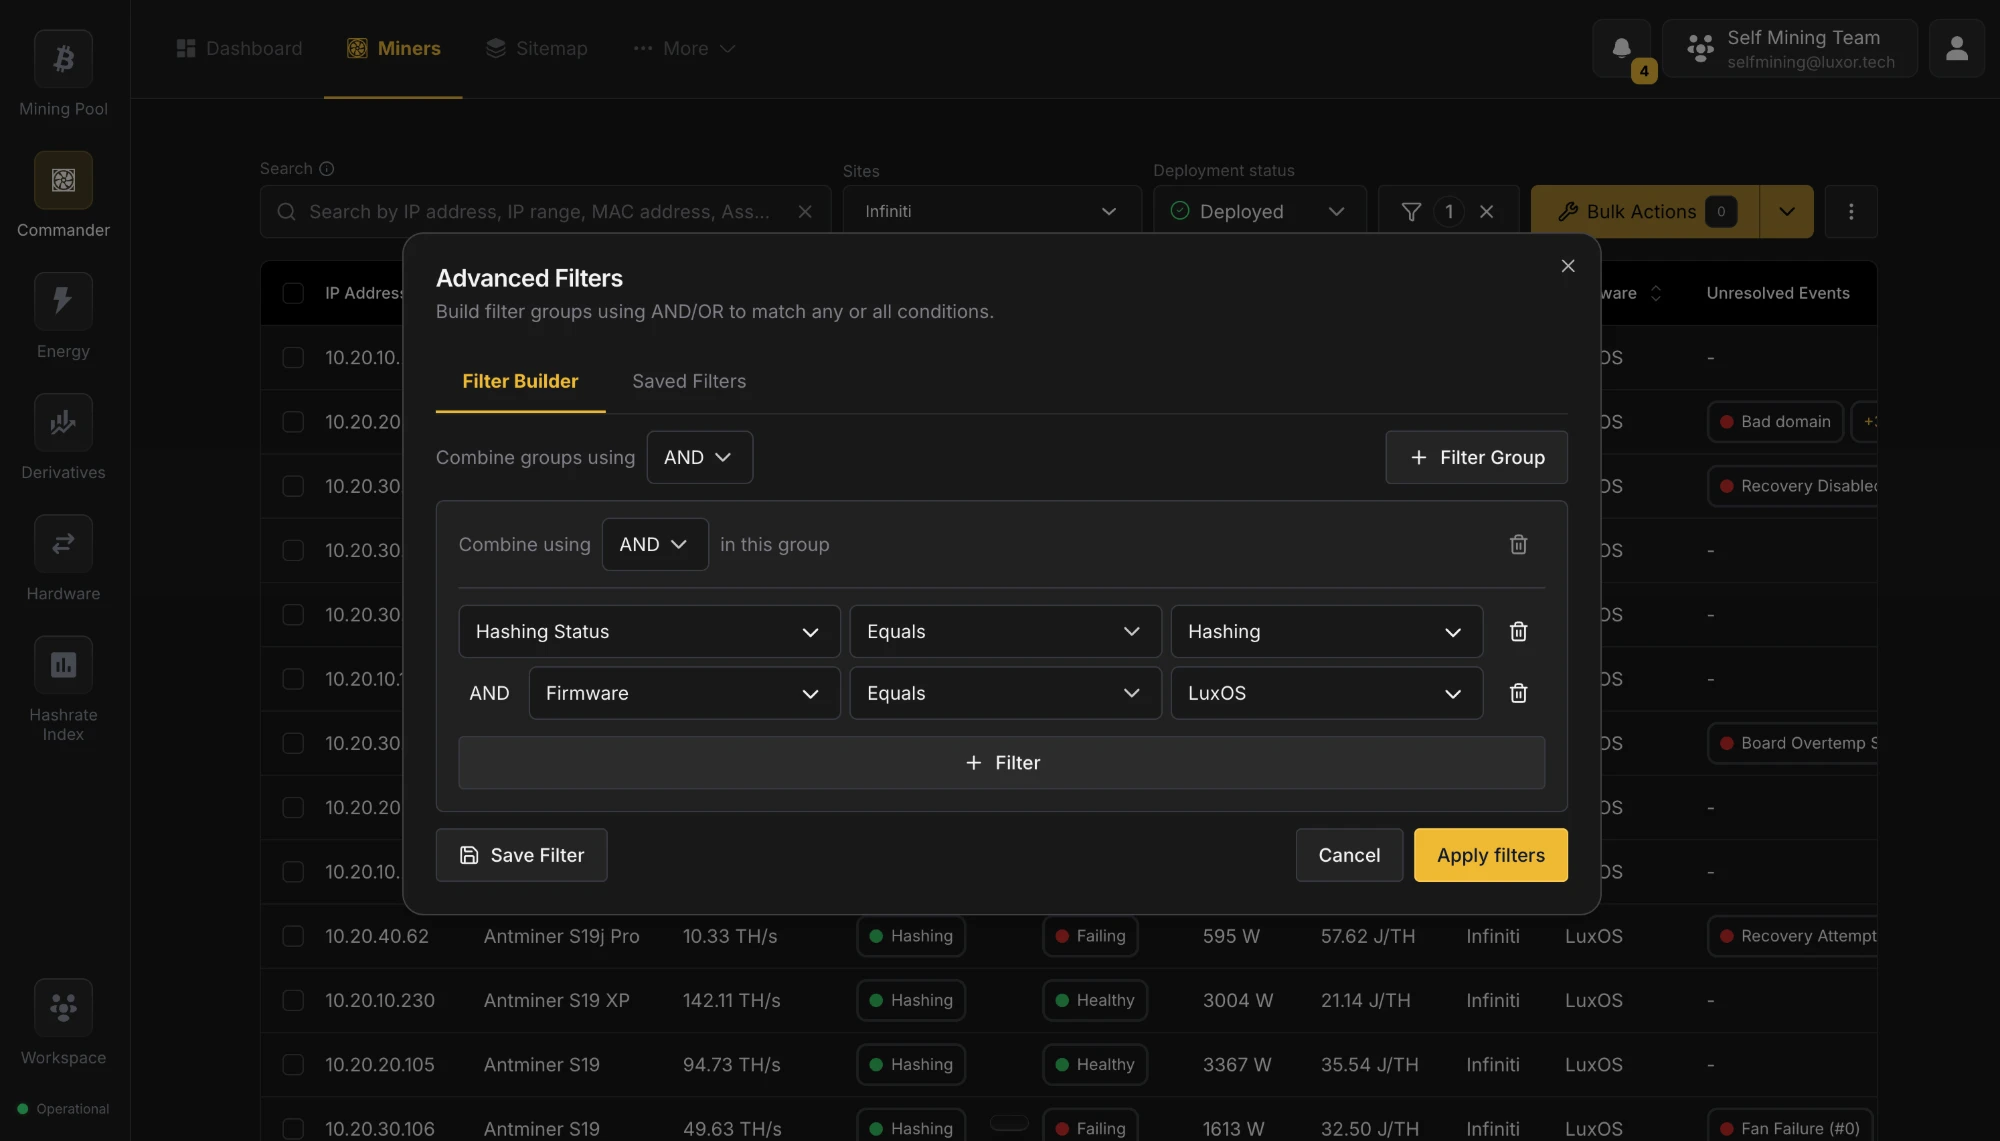
- Advanced Filters (filter icon): narrow the list by model, firmware, error code, group and rack, Hosted Client, and more, combining conditions with AND/OR. Save filters you use often with Save Filter.
- Bulk Actions: act on the selected miners. See Bulk Actions.
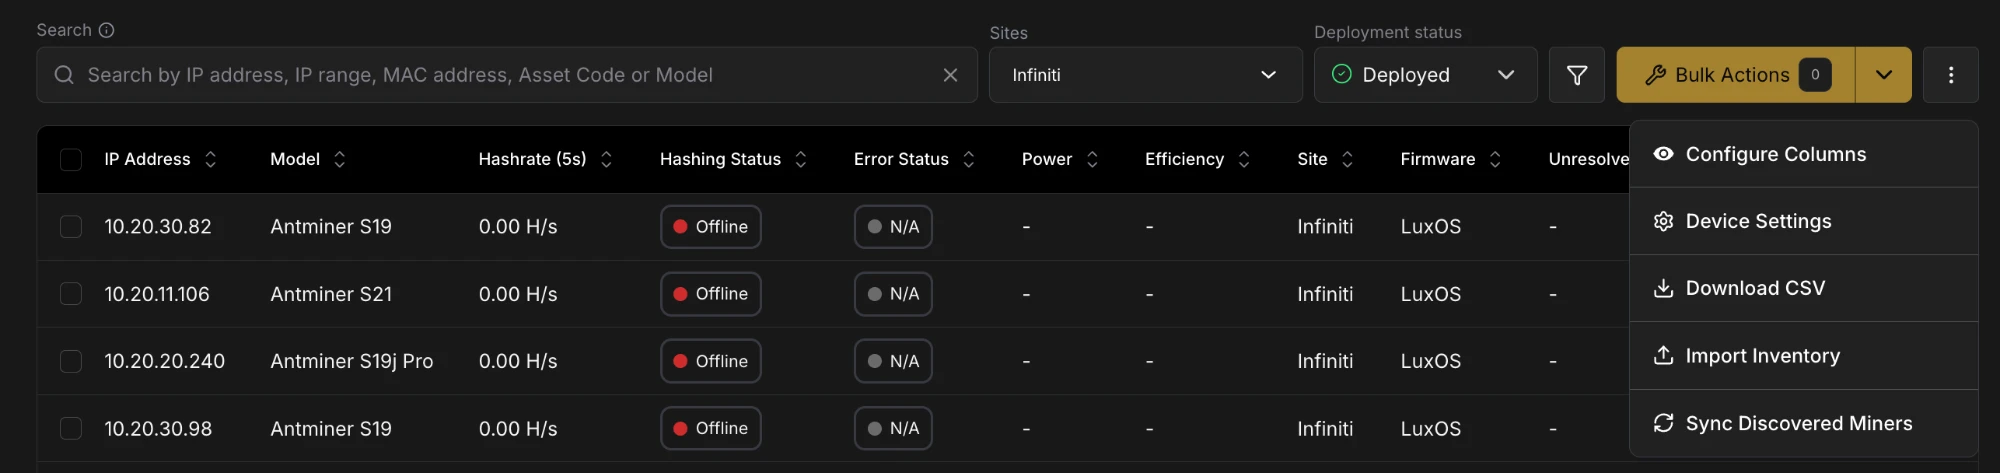
- ⋮ menu: table options, described in Table Menu.
Deployment Status Views
The Deployment status dropdown switches the list between the miners in each deployment status. It defaults to Deployed.
- Deployed is your live fleet: every miner installed at a site, with its real-time telemetry. This is where you send commands to miners and export the list as CSV.
- Ready to Deploy, In Repair, In Storage, and Retired show the hardware you own that isn't running: machines waiting to be installed, out for repair, on the shelf, or retired. You can still edit or delete these miners, for example to move them back to Deployed with Edit User Data.
Columns
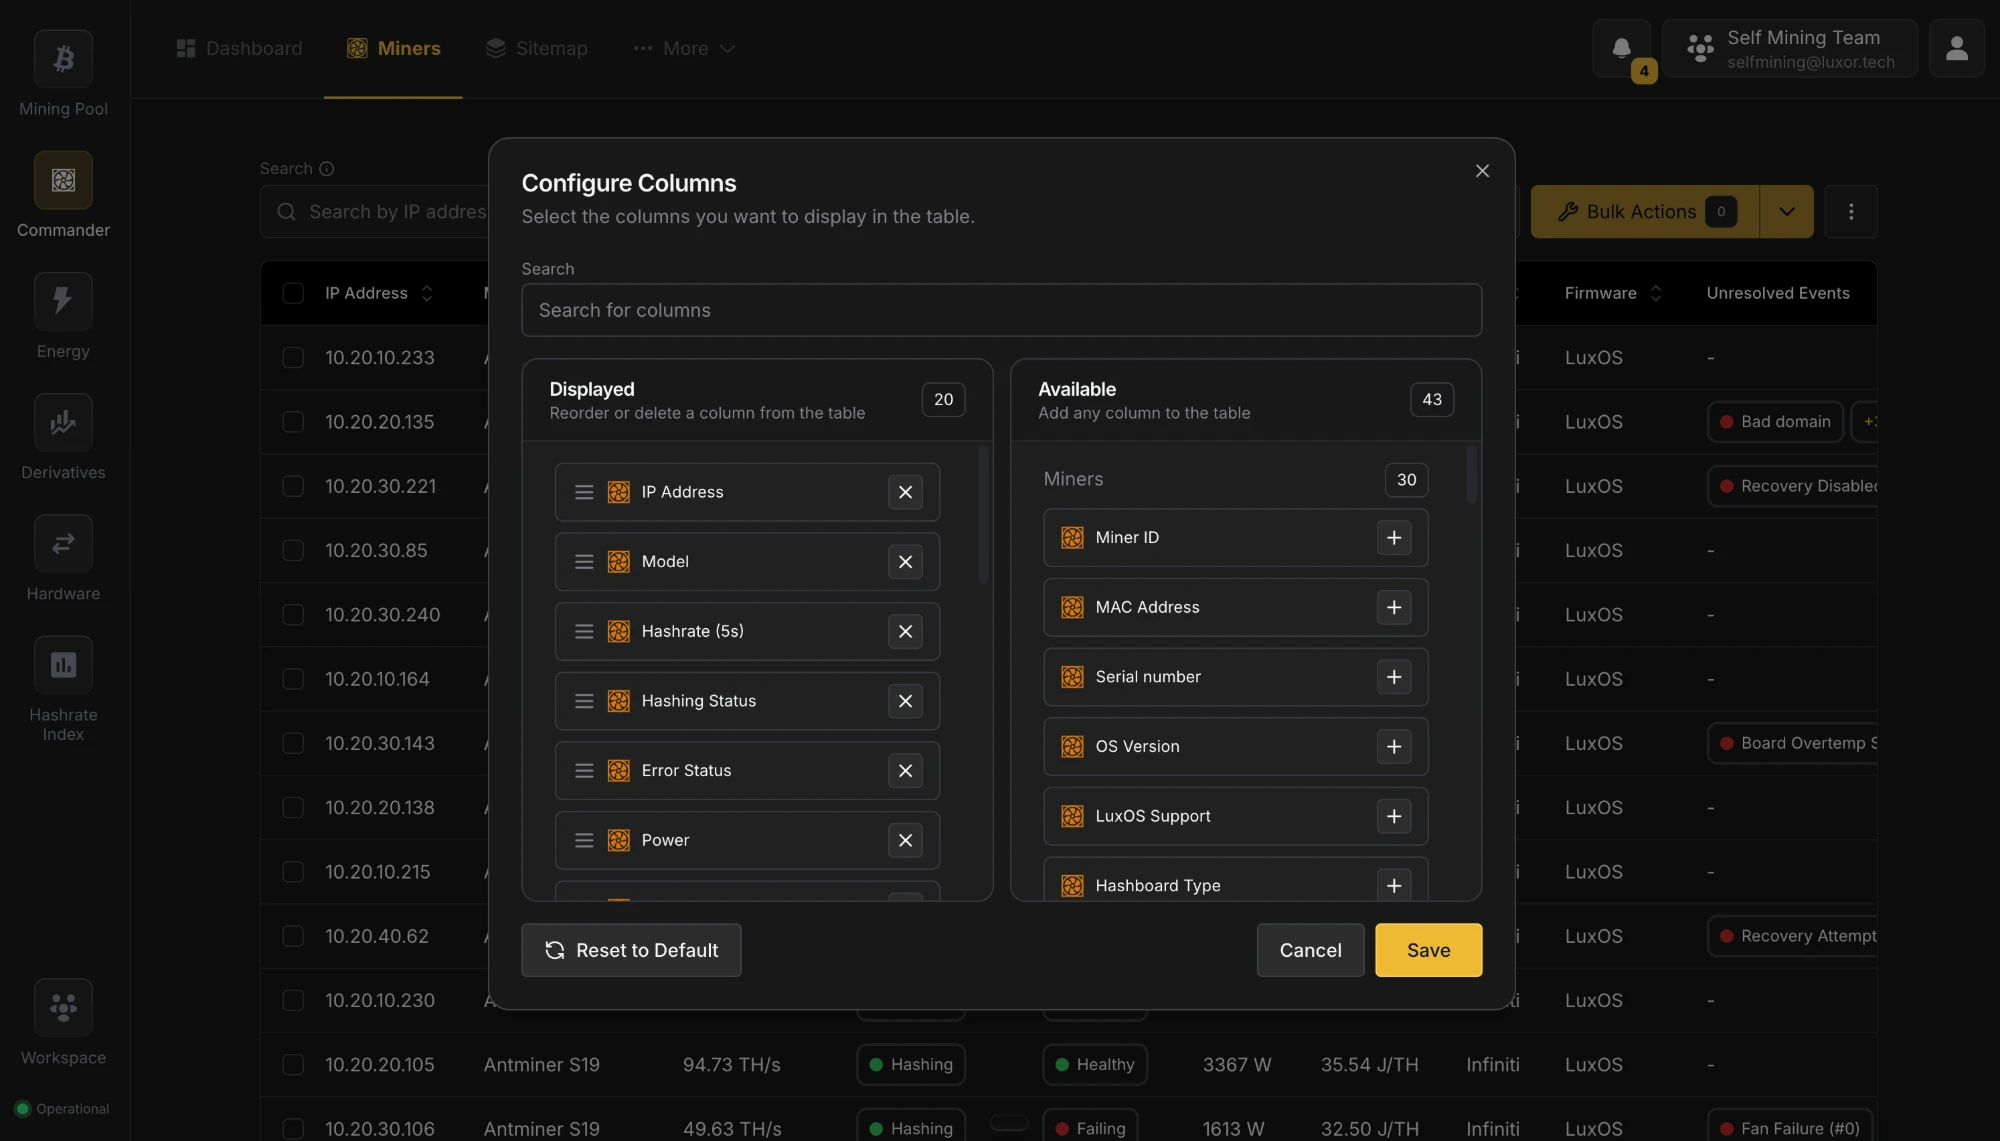
By default the table shows IP Address, Model, Error Status, Hashing Status, Pool Status, Hashrate (5s), Power, Efficiency, Unresolved Events, Firmware, Site, Position, Agent, and Max Temperature.
Use ⋮ → Configure Columns to show, hide, and reorder columns on the Deployed view. Your choices are saved for you. Besides the defaults, you can add:
- More telemetry and hardware columns, such as MAC Address, Serial number, Hashing Algorithm, PSU Type, Hashboard Type, Stratum URL, and power settings.
- User-managed columns, such as Asset code, Client, Deployment status, Supplier, Acquisition date, and Warranty expiry.
- Custom Fields your Workspace defines.
- Economics columns, where enabled: Uptime, Energy Used, Energy Cost, Est. Revenue, and Est. Profit over the last 24 hours.
Click a column header to sort by it, and add more columns to the sort to build views such as "sort by Error Status, then by Hashrate". The Unresolved Events column shows each miner's latest unresolved error, with a +N badge you can hover to see the rest.
Click a row to open its Miner Details page.
Selecting Miners
Select miners with the checkboxes in the leftmost column. Hold Shift and click a second checkbox to select every row in between. The selected count appears on the Bulk Actions button.
Table Menu
The ⋮ button next to Bulk Actions opens the table menu:
| Item | What it does |
|---|---|
| Configure Columns | Show, hide, and reorder table columns |
| Device Settings | Manage your Custom Fields and restore Deleted Miners |
| Download CSV | Export the Deployed list, with your current search and filters, as a CSV file |
| Import Inventory | Add or update miners in bulk from a CSV file (see Adding Miners) |
| Sync Discovered Miners | Add miners your Agents have just discovered right away, instead of waiting for Commander to pick them up automatically |
Alerts
When something in your fleet needs a decision, an alert banner appears above the table. If several are active they share one banner: use the arrows to move between them, View to act on one, and ✕ to dismiss it.
| Alert | What it means | View opens |
|---|---|---|
| Network activity detected | Miners marked In Repair, In Storage, or Retired are hashing on the network | A list of those miners, each with a Set to Deployed button |
| Deleted miner(s) still reporting | A miner you deleted is still reporting to an Agent | Deleted Miners, listing those miners so you can restore them |
| Miners not recently scanned | Deployed miners haven't been seen by an Agent in 30 days | The Retire stale miners dialog, where you pick which ones to retire |
| New miners added | Agents have discovered new miners | The Deployed view, with the newest miners first |
See Miner Lifecycle for how these situations arise.
Hosted clients
Hosted clients who sign in to Commander see only the Deployed view of their own miners. Deployment statuses, user-managed details, imports, and alerts are for the operator.
Tips
- Start from the Deployed view to find machines that need attention, then open Miner Details to see their history and act on them.
- Save the filters you use often, so you can isolate the same groups of miners in one click.
- Use the other Deployment status views to see hardware that is in repair, in storage, or waiting to be deployed.
- Cross-reference the Unresolved Events column with the Logs tab to understand an error's context.